A project management office dashboard or (PMO) dashboard is one of the most important tools for virtual reporting, it provides a real-time view about all the projects, operations and programs that take place under any organisation ot company for effective management.
It helps in real-time coordination among members of the organisation and helps in analysing timelines, risks and managing all kinds of data for an organisation’s effective performance.
To set up a PMO dashboard is one of the most important tools which is to be set up for optimum resource utilisation, maintaining task records and getting real-time updates on your portfolio performance.
The best part? You can set up your first PMO dashboard in under 30 minutes, even if you’re not a tech-savvy expert.
Here’s your step-by-step guide to setting up your PMO dashboard in under 30 minutes.
Step 1: Define the Purpose of Your PMO Dashboard in under 5 Minutes
Before you track reports and other charts, start with clarity and purpose
Ask yourself:
- For whom are you setting up the dashboard for executives, project managers, or team leaders.
- What business queries should it answer?
- What kind of data should your PMO dashboard it should monitor?
Common PMO Dashboard Goals
- Should track project progress and timelines
- Monitor budget and optimum resource utilisation
- Identify risks or delays before the due date.
- Align projects with strategic goals and business targets.
If you keep your purpose aligned while setting up the PMO dashboard, it can help you achieve significant growth and help you manage the organisation effectively.
Step 2: How To Choose the Right PMO Tool Under 3 minutes
For beginners, you are not required to spend thousands to use the perfect PMO dashboard for your organisation. To initially setup your PMO dashboard you should look for the requirements and your organisation’s needs.
Below is the table which helps you to choose which PMO dashboard tool is best suitable for you.
| TOOL | BEST SUITABLE FOR | USP |
| Google Sheets and Microsoft Excel | Small Teams | Quick setup, user-friendly interface |
| Power BI or Tableau | Heavy - Data Organisations | Automated software for easy management |
| Asana / Monday.com / ClickUp | Agile teams | Built-in dashboards, task-level integration |
| Smartsheet | Mid-size PMOs | Combines spreadsheets with automation |
If you are looking for a project management tool for your organisation, then the above-mentioned tools can simplify your entire project management in minutes.
Step 3: Gather and Organise Your Organisation's Data Under 5 minutes
A PMO dashboard is only powerful if you appropriately add your data and tasks to it for proper project management.
Here is the list of how to organise your data on the PMO dashboard.
- Creating Project List: List all your planned and upcoming projects on the PMO Dashboard.
- Set the Timelines: Set up the appropriate deadlines for projects.
- Status Updates: Check for status updates like: On track, delayed, or at risk
- Set the Budget Plan: Manage your monthly budget allocation in advance at your PMO dashboard.
- Human Resources: Assigned team members or departments their specific dashboards.
Pro Tip:
Use a simple sheet to manage your data under columns like: Project Name, Status, Priority, Budget, End date, etc
Step 4: Identify Key Performance Indicators (KPIs) (5 minutes)
Choose metrics that help leadership take action.
Here are some must-have PMO KPIs:
- Project Status: % of projects on track vs delayed
- Schedule Variance: Difference between planned and actual dates
- Budget Health: Spend vs planned budget
- Resource Utilization: Team capacity vs workload
- Risk Level: Number of high or critical risks
Visualise these KPIs through traffic-light indicators (green/yellow/red) or progress bars to make the dashboard more efficient in terms of understanding.
Step 5: Build Your Customised PMO Dashboard (10 minutes)
Once your data is ready, start building clear visuals for clarity and efficient team management.
Software Layout
Keep it simple and logical for easy understanding :
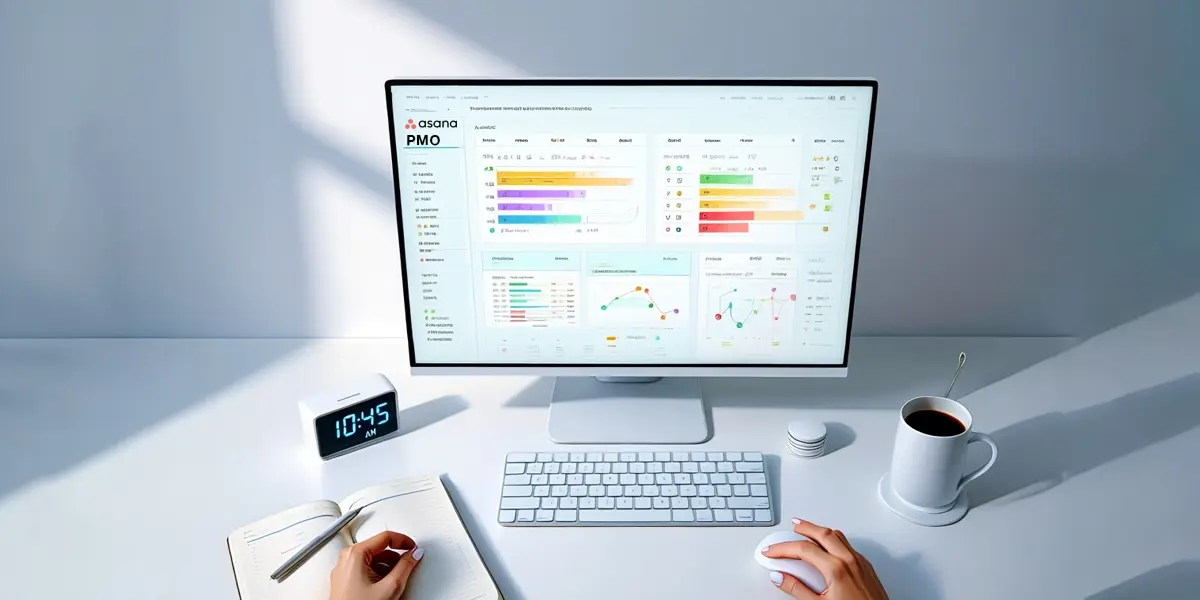
- Top Section: Key metrics and summary cards at the top of the PMO for getting an overview (project count, % on time, total budget)
- Middle Section: Charts showing project trends for analysing growth patterns on the PMO Dashboard.
- Bottom Section: Detailed tables for drill-downs to have clarity about all the scheduled tasks.
Visual Recommendations
- Bar Chart: Project progress comparison for smarter interpretation.
- Line Chart: Budget allocation or schedule variance over a time period.
- Pie Chart: Resource allocation by department and organisational hierarchy for finance management.m
- Table with Icons: Project details + traffic-light status for having clarity and efficiency.
If using Power BI, Asana, or Monday.com or any such tools, you can drag-and-drop prebuilt widgets for status tracking and real-time updates about your project and coordinate with team members effectively.
Step 6: Review, Automate, and Share Under 2 minutes
Once your PMO Dashboard is built, ensure:
1. Data updates automatically or can be refreshed easily for understanding.
2. Visuals are clear and actionable for upcoming tasks.
3. Access permissions are properly set for team coordination
Share your dashboard with executives and stakeholders through view-only links or weekly snapshots for clarity and to build customer relationships with clients.
Step 7: Maintain and Improve Your PMO Dashboard
Dashboards evolve with your PMO maturity and your level of understanding about the PMO. With team building and regular work on the PMO Dashboard it can help you evaluate your PMO progress and have efficient work management.
- Add new metrics as your team grows for better communication
- Integrate data sources (finance tools, HR systems, CRMs) for effective team management.
- Automate updates to reduce manual work within your organisation
- Use insights to improve forecasting and decision-making
Your organisation’s dashboard should continuously evolve as it helps your organisation to achieve better targets and growth rates.
What to Include in a 2025-Ready PMO Dashboard
In 2025, modern PMO dashboards are moving toward data-driven decision-making and strategic planning for effective organisation management and client delivery.
Here’s what your modern PMO dashboard should include:
- AI Insights: Predict delays or resource bottlenecks for preparedness.
- Data Management: Integrate finance, HR, and operations metrics for automated updates on data.
- Goal Tracking: Link project KPIs with strategic OKRs for effective team management.
- Scenario Planning: Model the impact of delays or budget cuts to ensure streamlined functioning.
Conclusion
You don’t need a massive budget or complex software to launch a PMO dashboard for your organisation’s growth. With clear goals, clean data, and the right PMO tools, you can set up a functional, insight-rich PMO dashboard in under 30 minutes for your organisation’s growth.
A good dashboard does more than report numbers; it tells a story about your organisation’s performance, priorities, and potential to grow.
Start simple. Stay consistent. And let your PMO dashboard become the single source of truth for smarter, faster, and more strategic for efficient decision-making.


Comments (0)
No comments posted yet. Be the first to comment!